 a.space
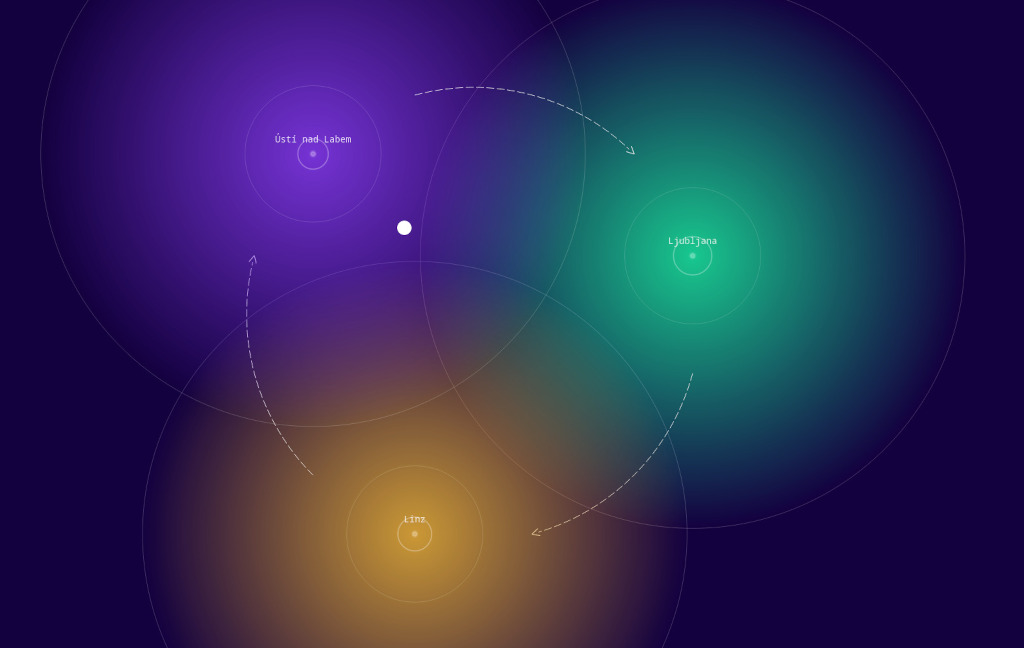
Interface for a distributed sound installation (2022)
Samples
a.space
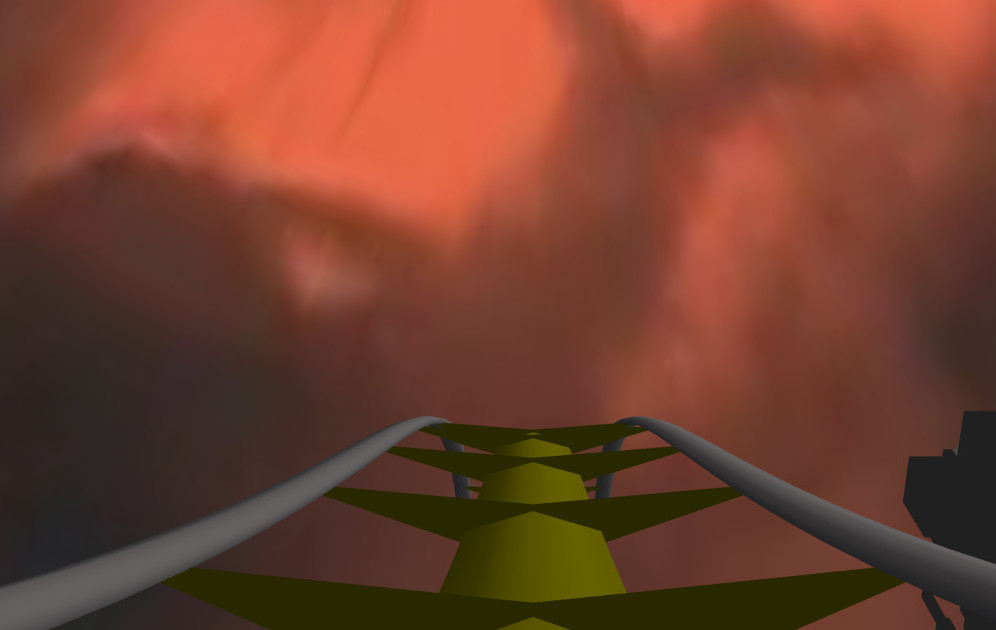 Coupled Data Intercomparison Extended Reality Roller Coaster
Ride along and experience real datasets (2021)
Coupled Data Intercomparison Extended Reality Roller Coaster
Ride along and experience real datasets (2021)
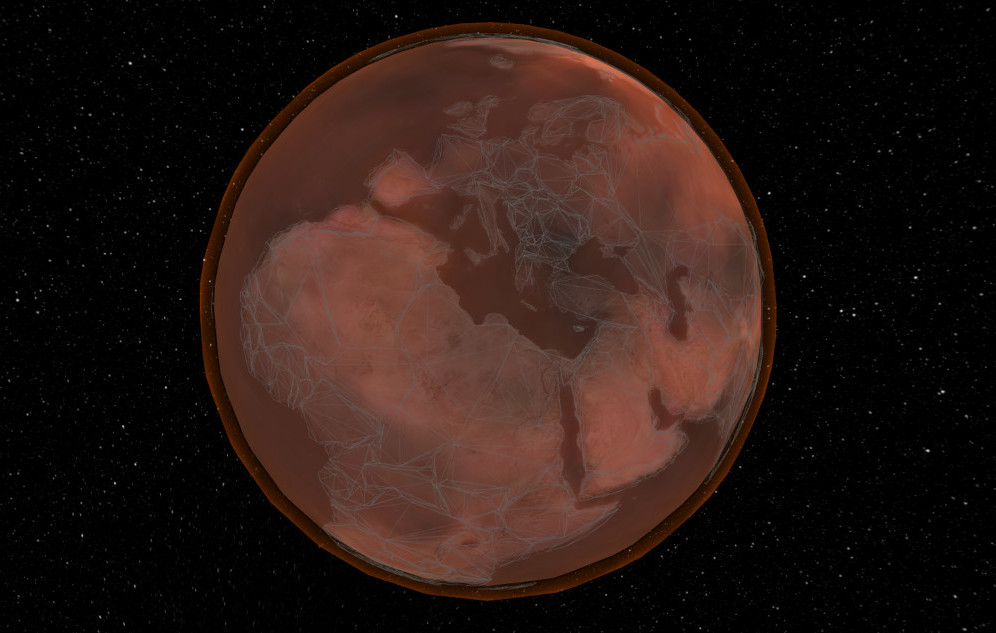 A warming globe
 visualization based on climate model data (2021)
A warming globe
A warming globe visualization based on climate model data (2021)
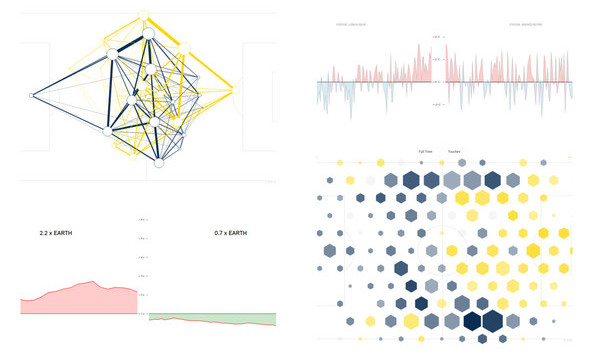
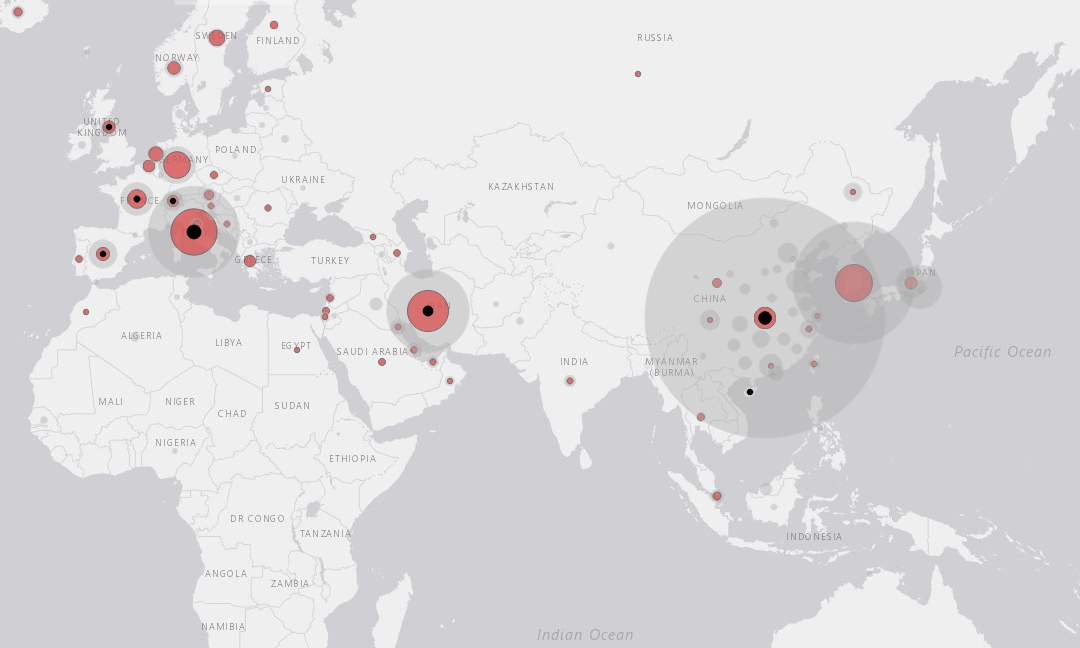 COVID 19, CO2 & CO * A Timeline
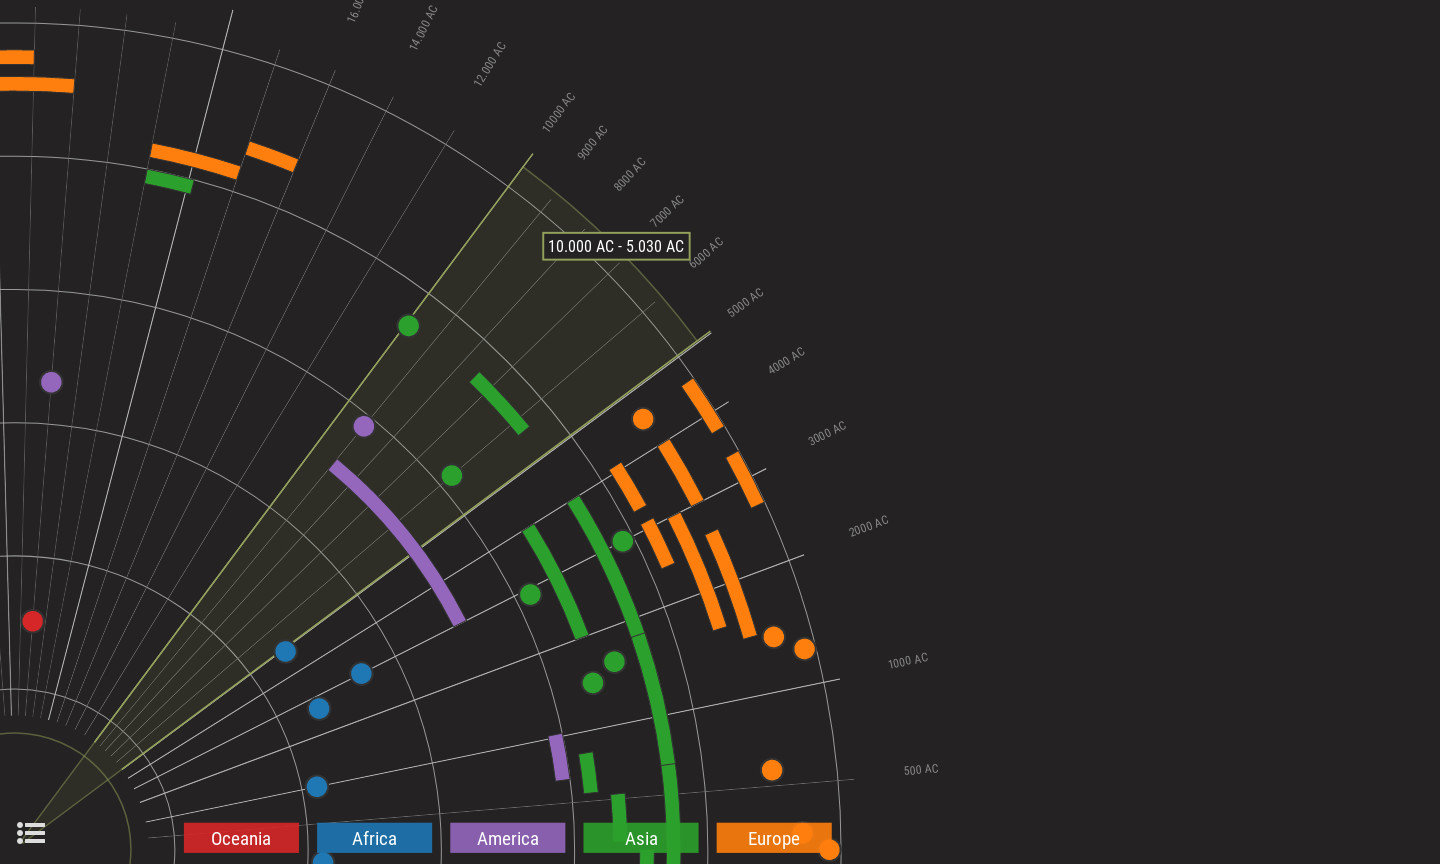 Wheel of Time
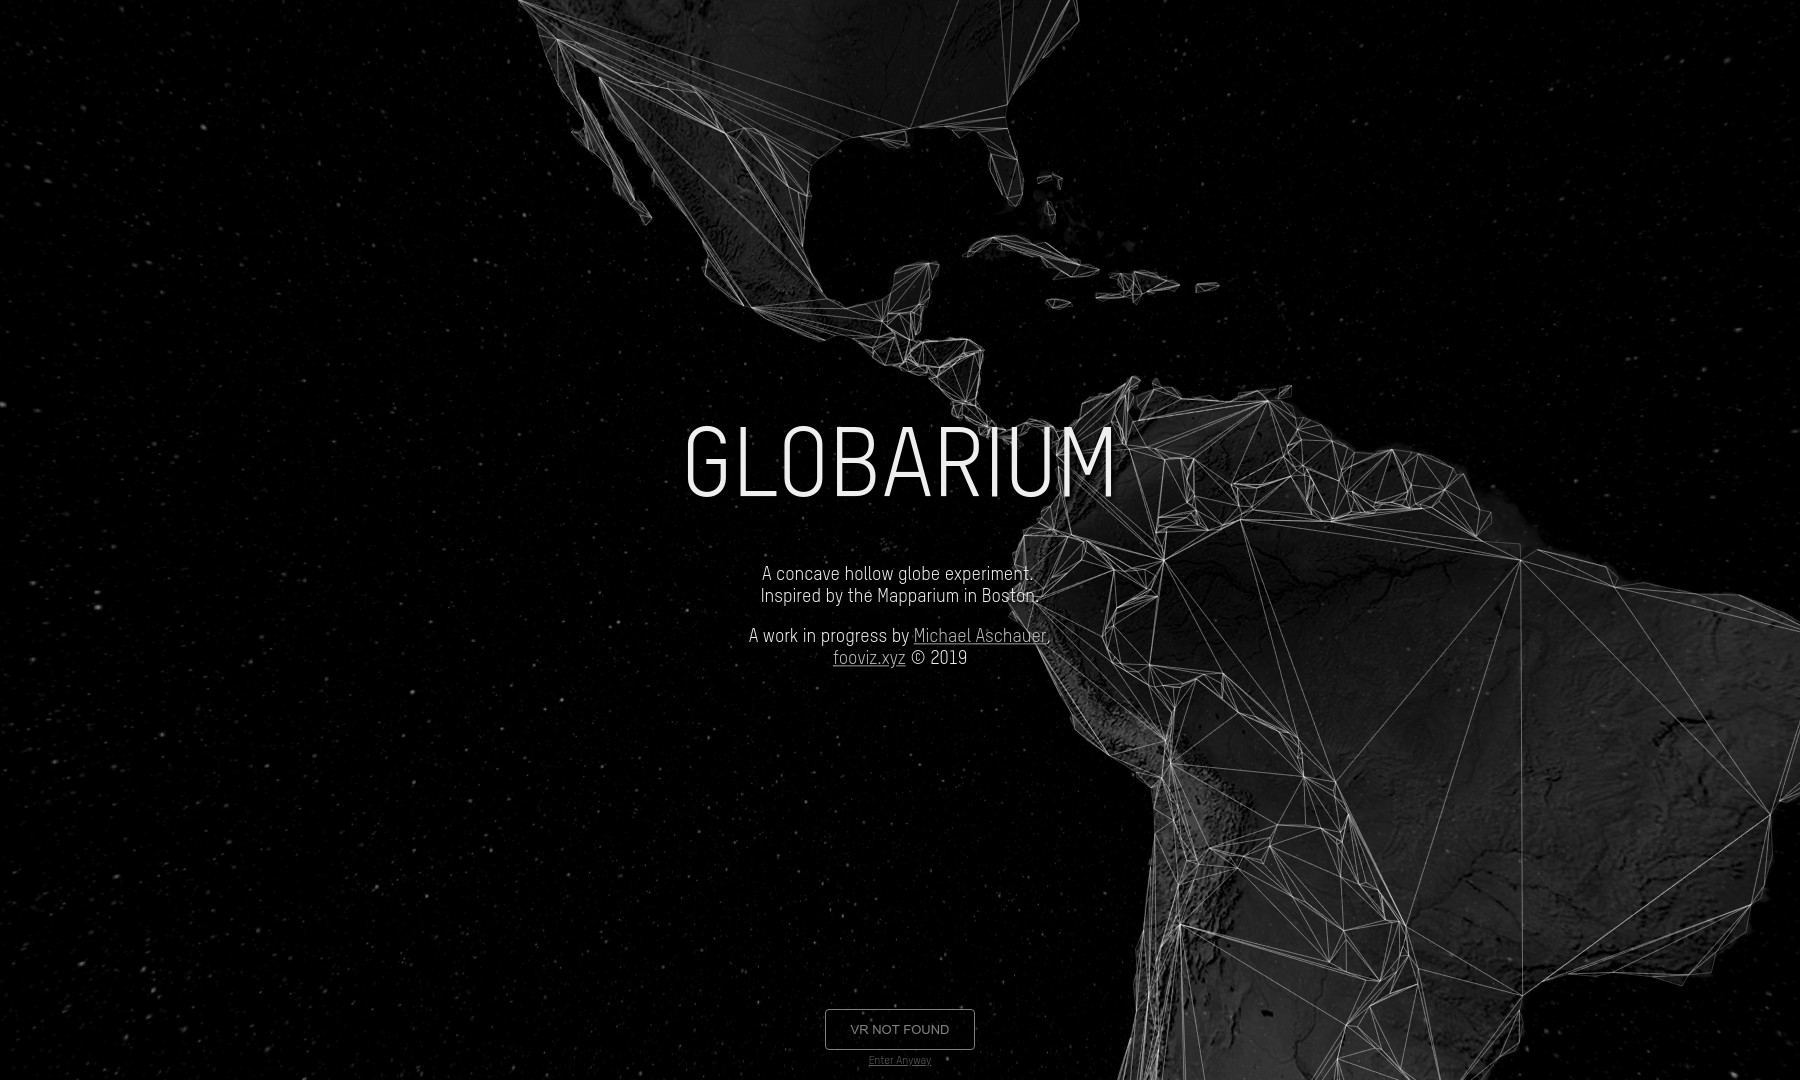 Globarium
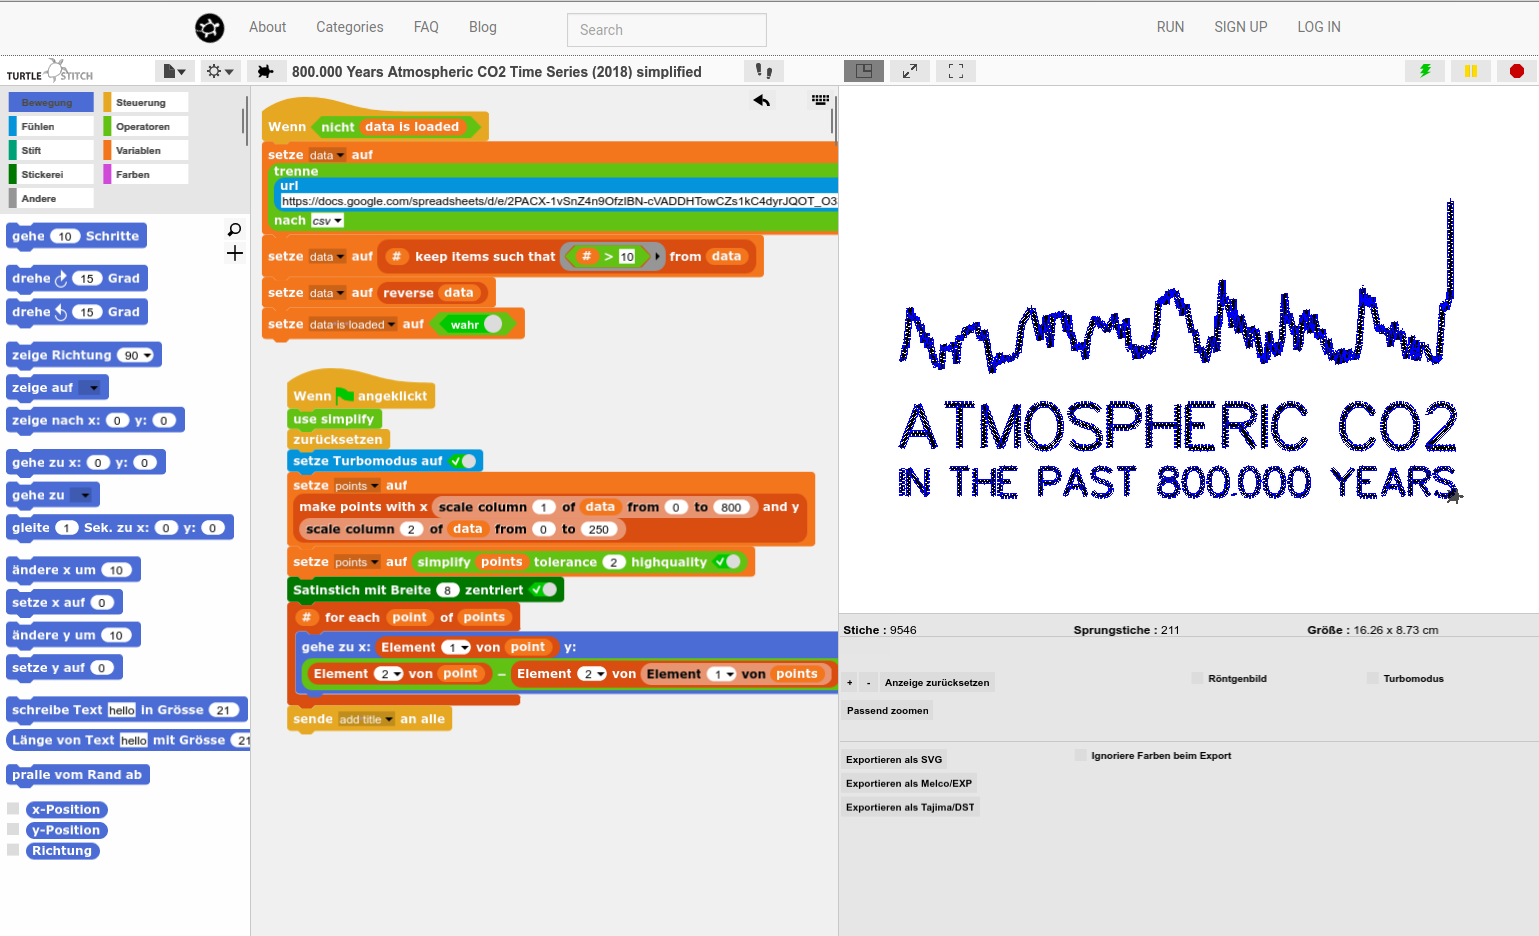 TurteStitch
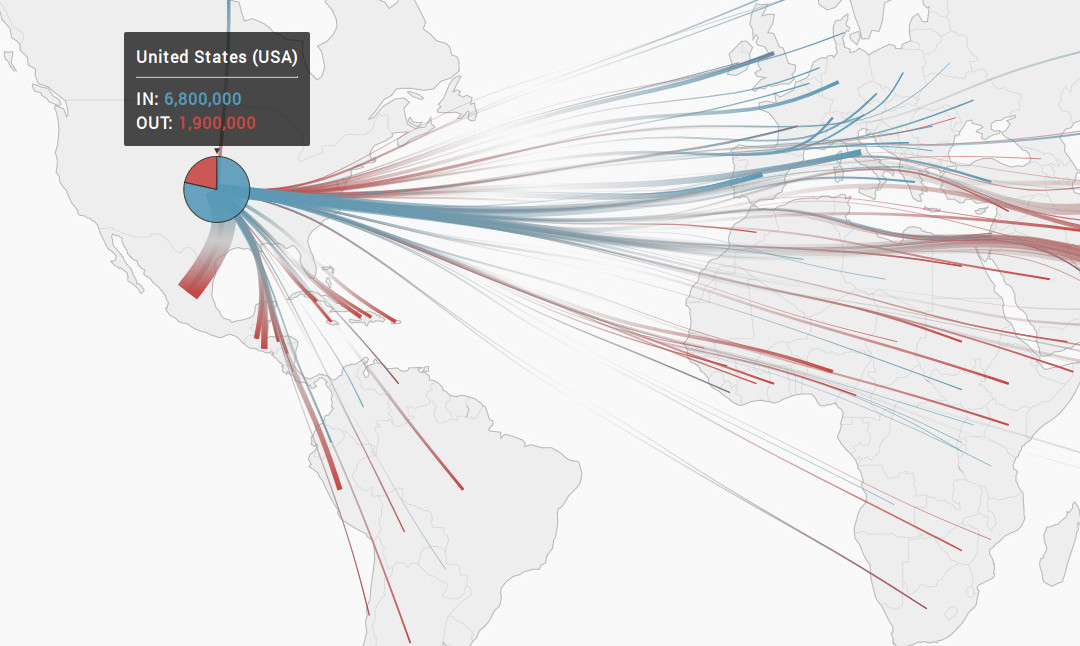 Human Flows